Interpreting Covariances/Correlations in Path Analysis
by Arndt Regorz, MSc.
August 04, 2024
In a path analysis (= an SEM model with measured/manifest variables only) you often model covariances, or in the standardized solution, correlations. How to interpret them? That is not as straightforward as it may seem.
1. Covariances between Exogenous or Between Endogenous Variables
First, we look at a simple model example with two exogenous variables (IV1 and IV2) and four endogenous variables (MED1, MED2, DV1, DV2), see figure 1.
Figure 1
Example with Covariances
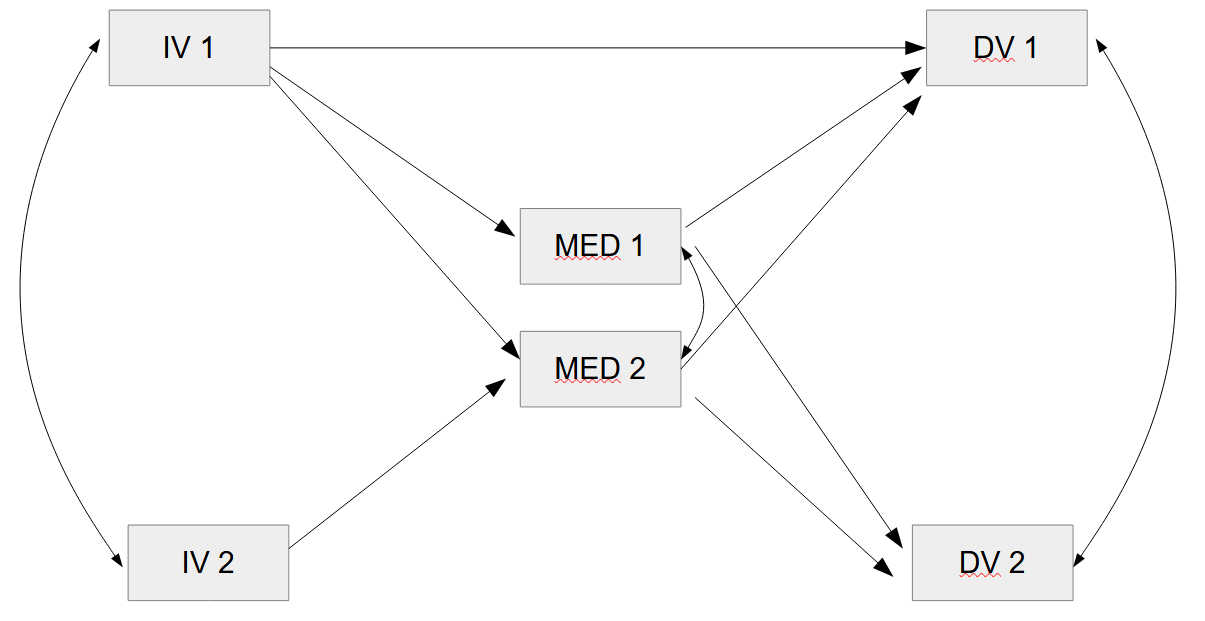
Here, we have three covariances: Between both independent variables IV1 and IV2, between both mediators MED1 and MED2, and between both dependent variables, DV1 and DV2.
Let’s say we get these results for the three covariances (figure 2):
Figure 2
Example Results for Covariances
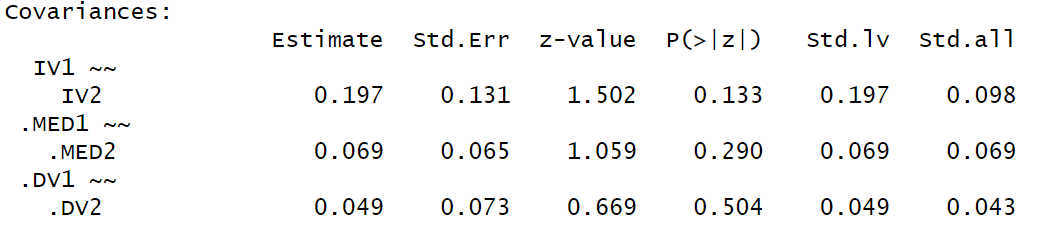
Note. This output was generated with R/lavaan.
How to interpret these covariances (or in the standardized case: correlations)? At first glance it looks simple: The standardized covariances seem to be the correlations between both IVs, between both mediators, and between both DVs.
Unfortunately, this way of interpreting the results would lead to a seriously wrong picture of reality.
In fact, the covariance IV1 and IV2 is the covariance between both measured variables.
However, for the covariance MED1 and MED2 and for the covariance DV1 and DV2 that is not the case. The reason for that can be seen in the full model diagram, including the disturbances for endogenous variables (figure 3).
Figure 3
Example Including Disturbances
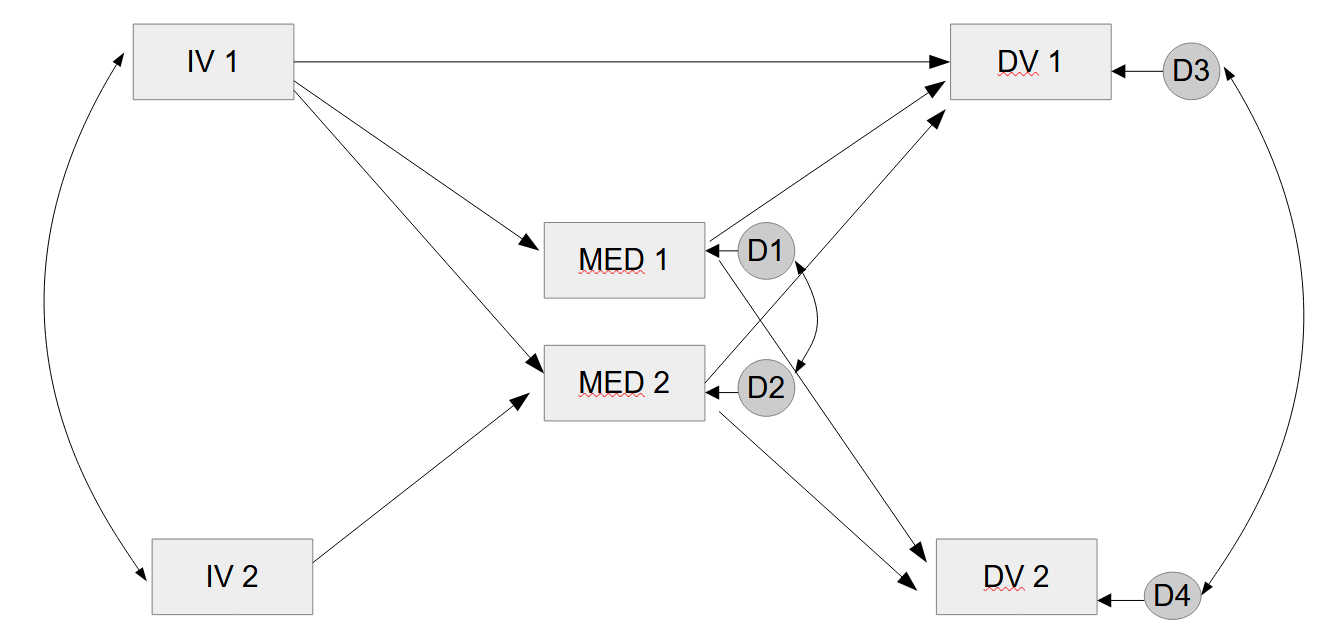
Here we can see that there is no covariance between MED1 and MED2. Instead, there is a covariance between the disturbance (= error term) of MED1 and the disturbance of MED2.
The same applies to the dependent variables. The covariance there is between the disturbances of DV1 and DV2, not between DV1 and DV2 per se.
If you look at the output in figure 2 very closely, there was a hint: In the lavaan output there was a covariance between IV1 and IV2, but the other two covariances were between .MED1 and .MED2, and .DV1 and .DV2 with a dot in front of the variable name. The leading dot indicates in a lavaan output that this is not about the variable itself but about its error term or its disturbance.
If you work with AMOS instead, there you have to explicitly model disturbances/error terms. Maybe you noticed there that you can’t draw a covariance arrow that is connected to an endogenous variable (e.g. a mediator or a dependent variable) in AMOS. Instead, you have to connect that arrow to the disturbance of the endogenous variable.
As a general rule you should note:
For exogenous variables covariances are about the variable itself.
For endogenous variables covariances are about the disturbance of the variable, not about the variable itself.
2. Interpreting Covariances
How to interpret those two different kinds of covariances?
A covariance between two exogenous variables answers a very simple question: What is the relationship between those two constructs?
A covariance between two endogenous variables (or, more precisely, between their disturbances) answers a very different question: What is the relationship between that part of those two constructs that is not predicted by the model?
What does this mean? Let’s look at a very simple (and fictitious) example, modeling the influence of stress on anxiety and depression (figure 4).
Figure 4
Two Correlated Dependent Variables
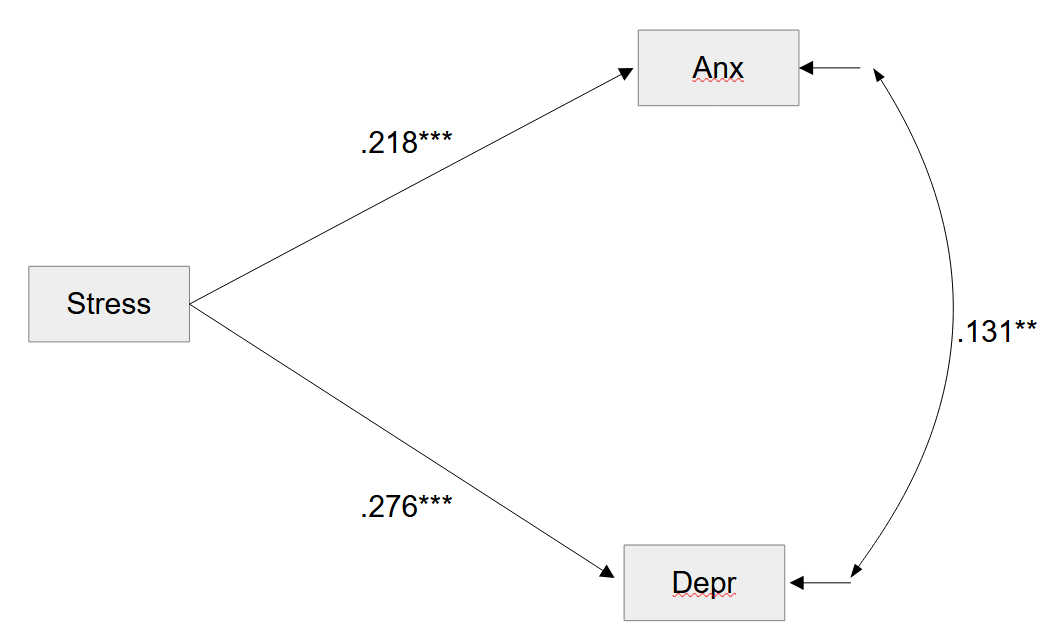
Note. Standardized solution (correlation instead of covariance).
Here, we see a positive correlation between anxiety and depression. But these two variables are endogenous variables, so this is not about the well known fact that anxiety and depression are positively correlated with each other.
Instead, the correlation is about the residuals of anxiety and depression, those parts of the constructs that are not explained by the model, and in this example that are not explained by work-related stress.
So, even after controlling for the influence of work related stress (which will probably impact both anxiety and depression and therefore generate a positive relationship between both variables) there still remains a positive relationship between depression and anxiety.
What could be the reason for that?
This correlation of the disturbances could be the result of traits, e.g. high emotional instability, that may lead to higher depression and anxiety.
And it can be the result of other external influences. For instance family stress (e.g. a sick family member, relationship issues, etc.) could lead to higher depression and higher anxiety in some participants regardless of their level of work related stress.
3. Should You Model Covariances?
For independent variables (exogenous variables) I almost always allow covariances. Some SEM programs model these covariances automatically (e.g. lavaan). If you use a SEM software where you need to decide that (e.g. AMOS) I would include a covariance between the independent variables or, more generally, between the exogenous variables.
For mediators and for dependent variables (= endogenous variables) the decision depends on whether it is likely that there could be external influences on more than one mediator or on more than one dependent variable. When modeling related constructs (and that is often the case for more than one mediator or for more than one dependent variable) I believe that in most cases this is a realistic assumption. Therefore, I routinely include covariances between all (disturbances of) mediators in my models and covariances between all (disturbances of) dependent variables.
Citation
Regorz, A. (2024, August 04). Interpreting covariances/correlations in path analysis. Regorz Statistik. https://www.regorz-statistik.de/blog/covariances_path_analysis.html