Plotting Lavaan Models (SEM, CFA, Path Analysis) With lavaangui
by Arndt Regorz, MSc.
January 01, 2025
If you estimate a structural equation model (SEM), a confirmatory factor analysis (CFA) or a path model with R and lavaan, then you might want to produce a graphical representation of the results of your model. There are different R packages you can use to produce a figure with the model results, but many of them have disadvantages, especially when it comes to the customization of the graph.
A new R package, lavaangui, makes plotting a lavaan model much easier.
The package lavaangui (by Dr. J. D. Karch from Leiden University) is primarily a package to visually specify and estimate a model. With lavaangui you don’t have to write lavaan code anymore, you can simply specify your model by drag and drop. With this lavaan has probably become the easiest SEM program to use (If you are interested in this functionality, here is my tutorial for doing that: lavaangui: A Visual Tool for Creating lavaan Models [CFA, SEM, Path Analysis] in R). But lavaangui can also be used to plot a lavaan model you have estimated in the traditional way with lavaan syntax. This tutorial will show you how to do that.
Estimating the Lavaan Model
First, you need lavaan and lavaangui.
# install.packages("lavaan")
# install.packages("lavaangui")
library(lavaan)
library(lavaangui)
Then you estimate your lavaan model. In this example I estimate a CFA, but the same workflow can be applied for a full SEM or a path model.
model1 <- '
visual =~ x1 + x2 + x3
language =~ x4 + x5 + x6
speed =~ x7 + x8 + x9
x7~~x8
'
model.fit1 <- cfa(model=model1,
data=HolzingerSwineford1939,
std.lv =T)
summary(model.fit1)
The crucial step is unsing the plot_lavaan() function from the lavaangui package. As a parameter you use the resulting fit object of the model estimation:
plot_lavaan(model.fit1)
Running this code line there will be a new window in RStudio showing an initial plot of the model:
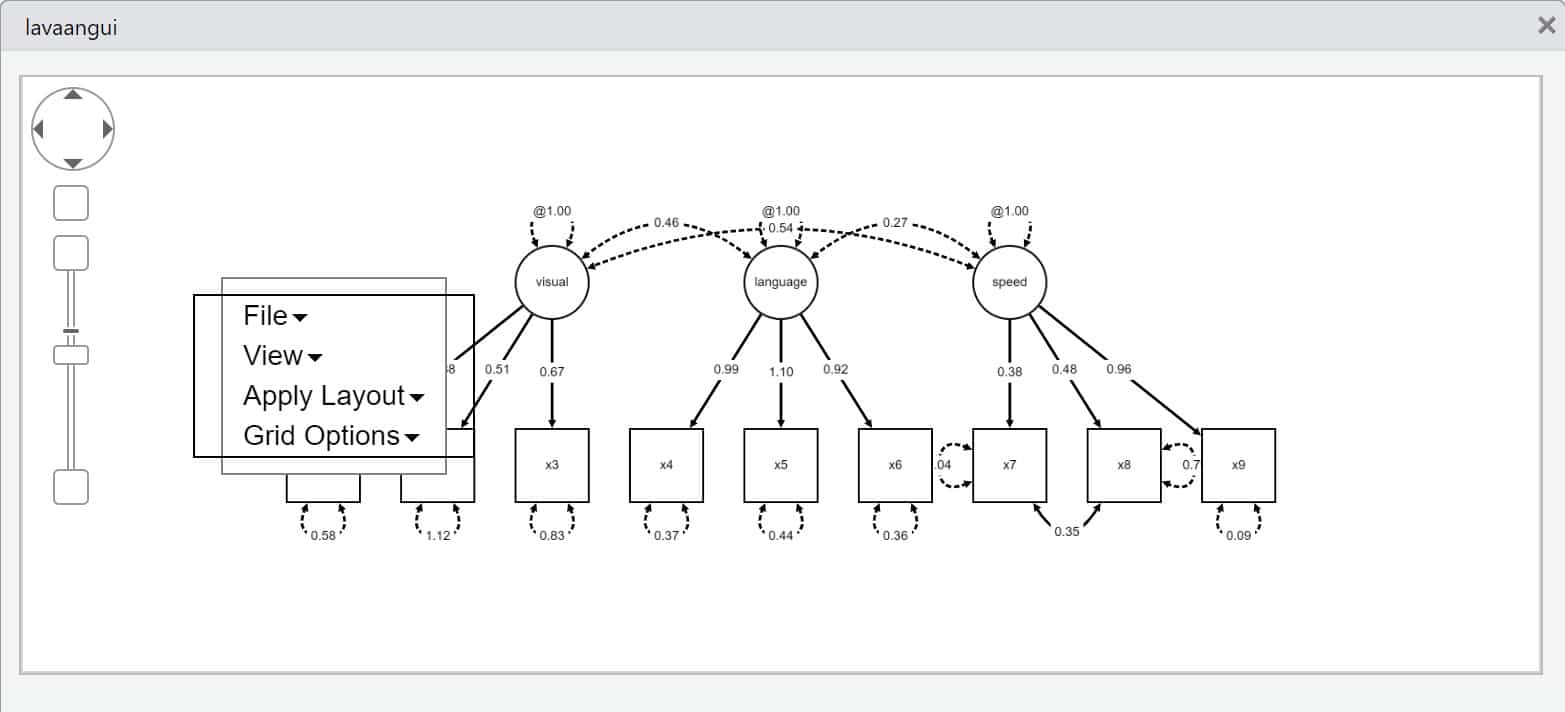
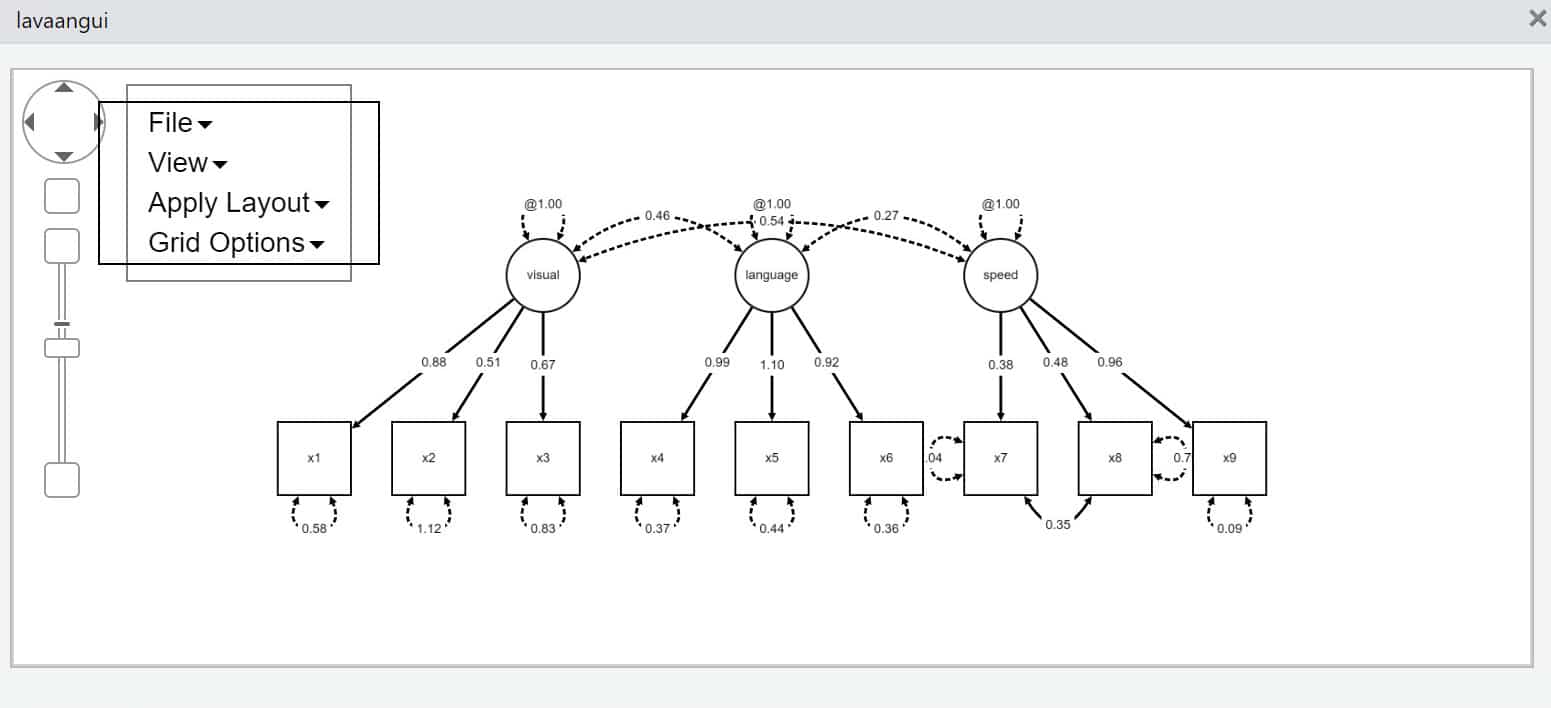
First, you can drag the menu to the left in order not to cover part of the graph.
Changing Individual Objects
By clicking on elements and then dragging them with the mouse you can move them.
If you want to move a group of objects, then you can click on all those objects pressing the Shift-key and then move all objects together.
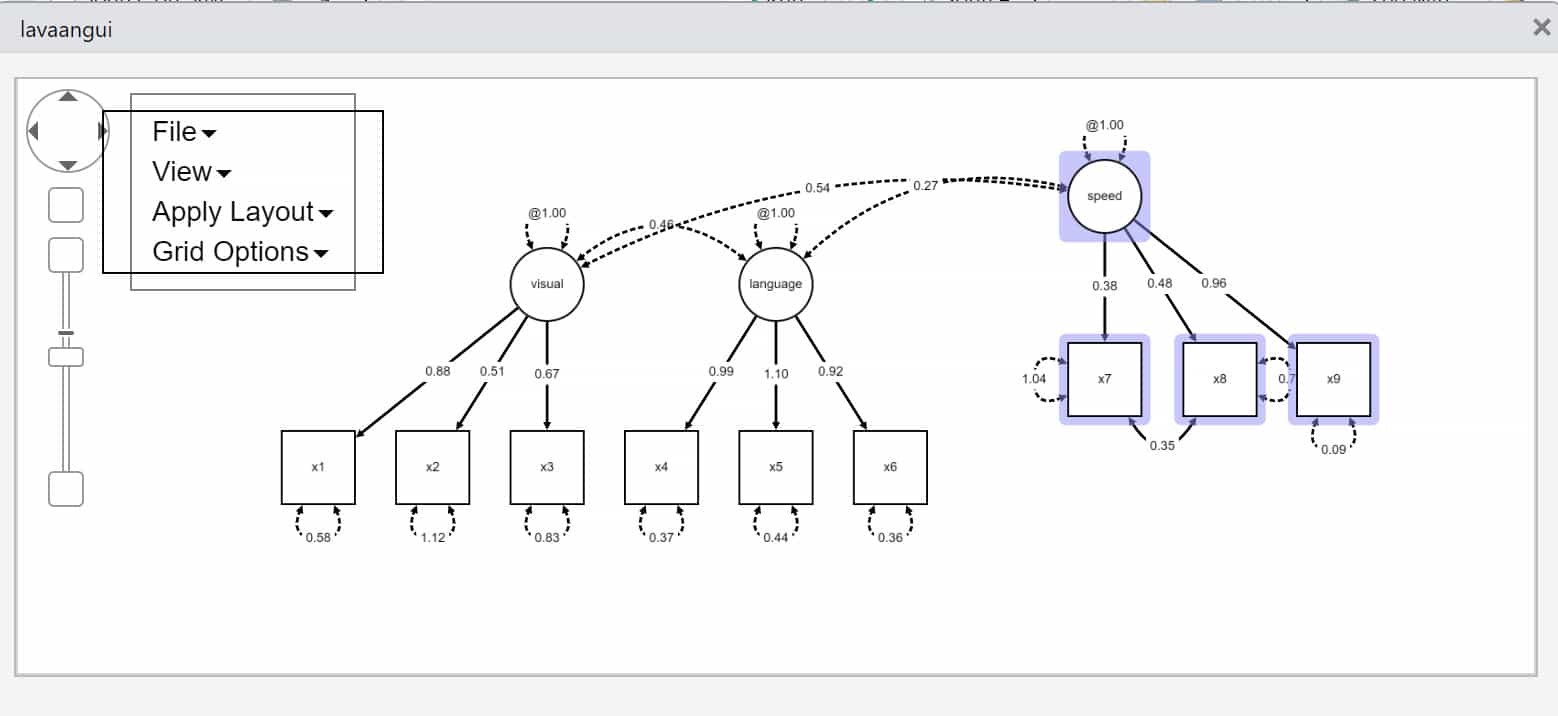
By right-clicking on an arrow or on a box you can change the background color, the border width, and the font size.
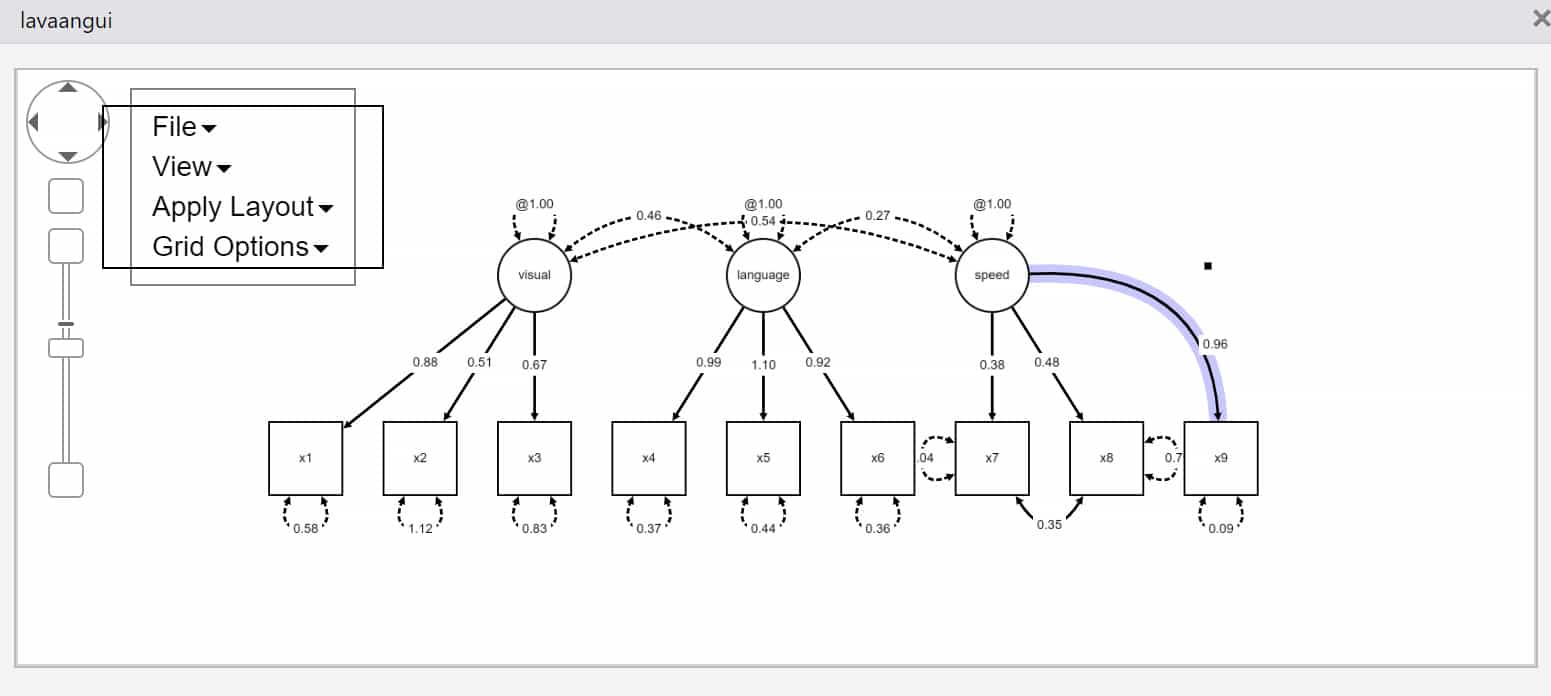
For arrows, you can also change the form by adding kink points or bend points. Then, you can drag the arrow using the kink point or bend point to change its form. Here with a bend point:
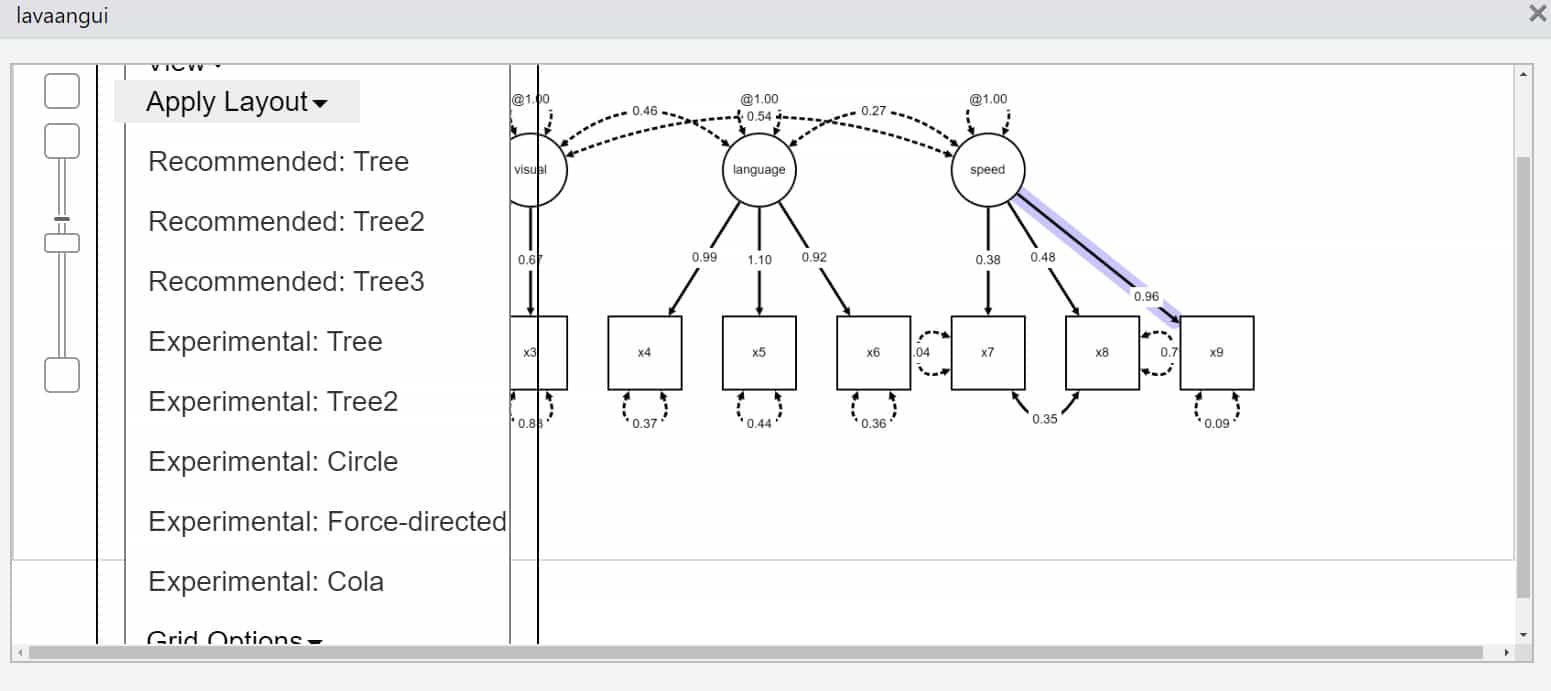
Standard Layouts
There are a couple of standard layouts implemented in lavaangui. You can access them using the menu “Apply Layout”. Those are especially helpful for CFA models.
Using a Grid
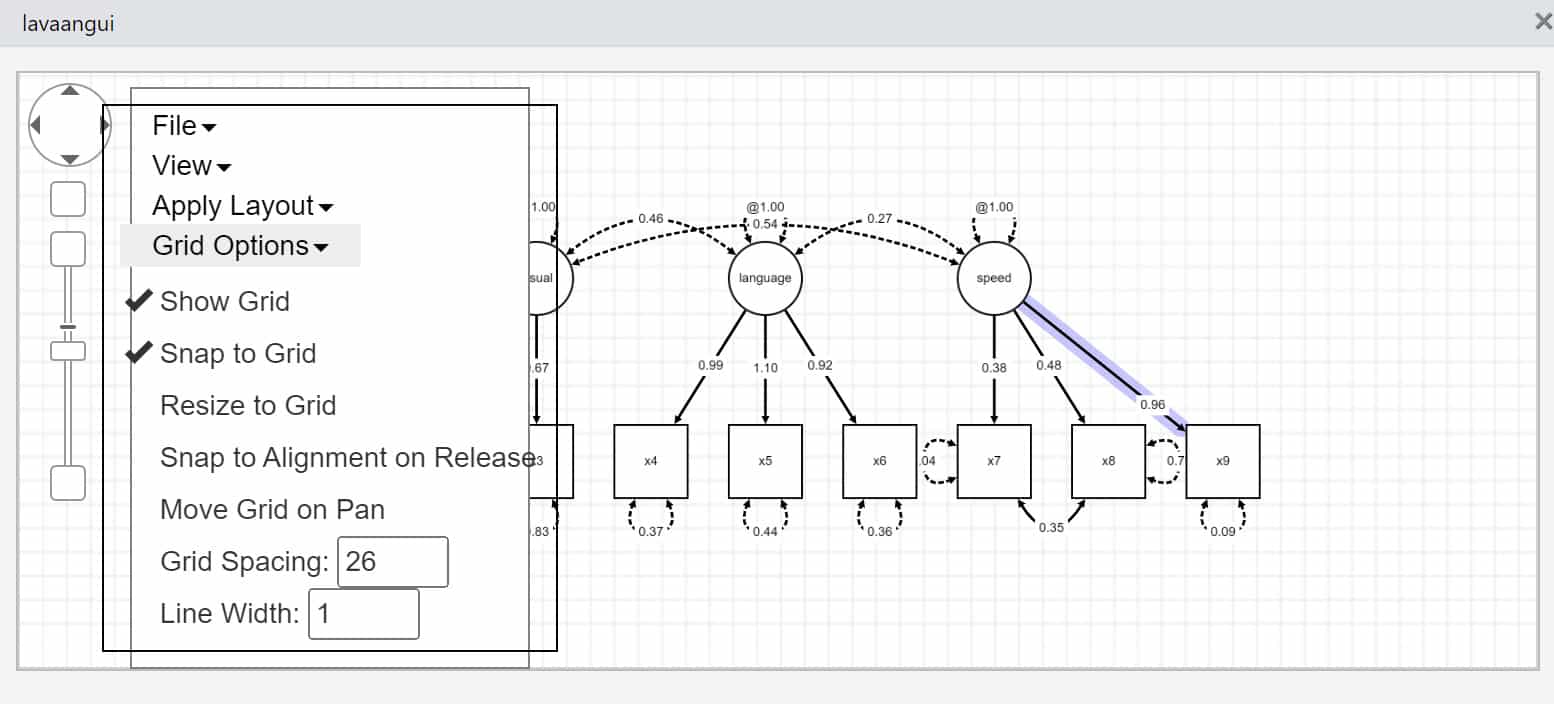
For drawing a model for which you don’t have a good standard layout (e.g., for a path model) it can be helpful to provide a grid and to automatically align the objects with the grid (e.g., with “Snap to Grid”). You can do that using the menu “Grid Options”.
Changing Which Estimation Results are Provided
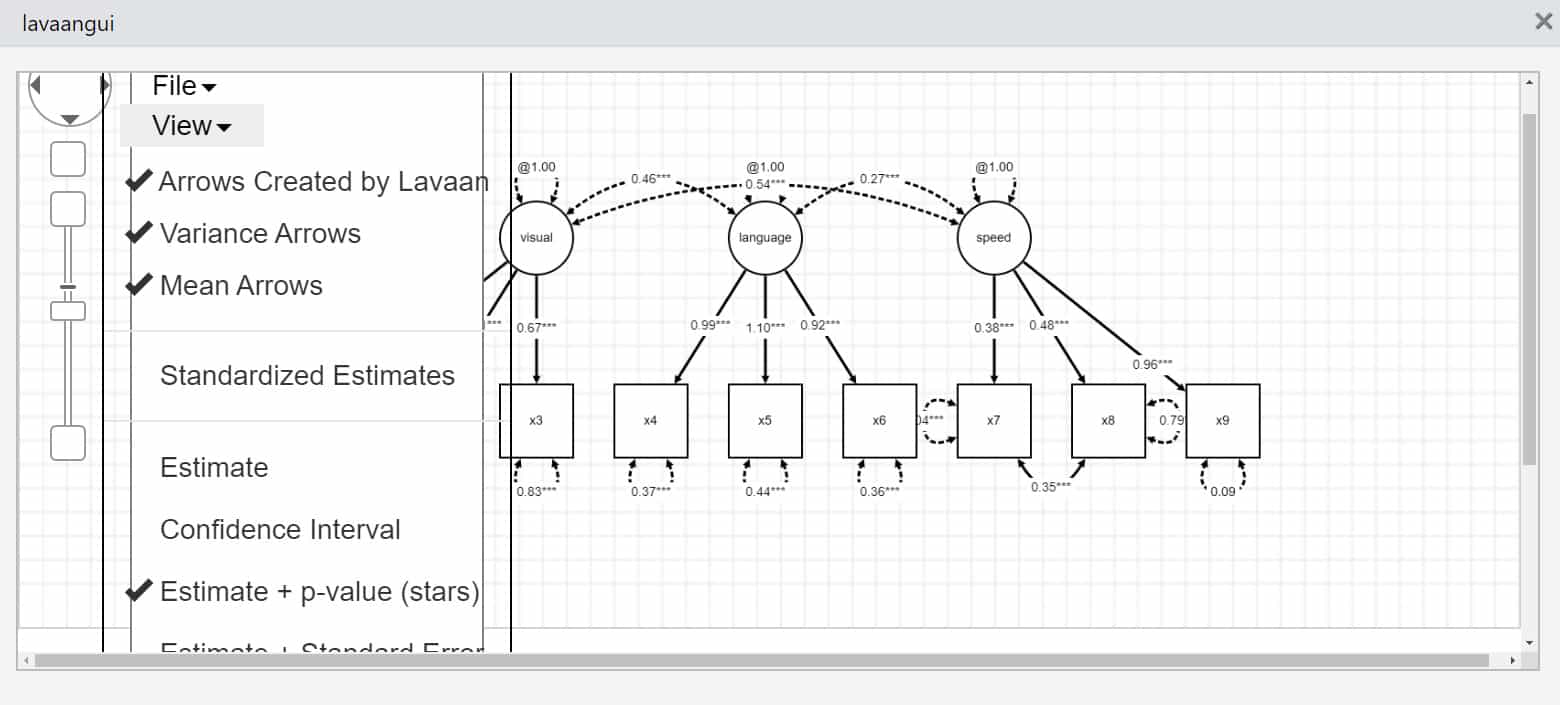
By default, you get unstandardized parameter estimates in the graphical output for your model. By using the menu “View” you can change this.
E.g., you can provide standardized parameters, symbols for the p-values, confidence intervals, etc.
Saving the Model Plot
If you have arrived at a plot that is satisfactory, then you can save the results using the menu “File”. There are different file formats available for the figure (JPG, PDF, PNG, SVG).
Reference
Karch, J. D. (2024, September 16th). lavaangui: A web-based graphical interface for specifying lavaan models by drawing path diagrams [preprint]. PsyArXiv. https://osf.io/f4ary
Citation
Regorz, A. (2025, January 01). Plotting lavaan models (SEM, CFA, path analysis) with lavaangui. Regorz Statistik. https://www.regorz-statistik.de/blog/lavaangui_plot.html